Capturing full rate debug data from moteus
Most users of the moteus brushless motor controller will perform diagnostics and monitoring over CAN-FD, using something like tview, the moteus python library or the moteus C++ library. These options are great, since CAN-FD works over long distances, allows multiple devices to be multiplexed and is relatively immune to EMI or other electrical disturbances. The biggest downside is that at best, you can capture telemetry a few thousand times a second. For instance here, 2.5kHz is the maximum achievable update rate with a pi3hat and a single moteus.
What should you do when you want to monitor events that happen faster than that? Well, moteus has a solution for that too, and while it isn’t nearly as convenient, it does get the job done for many uses. It is called “high rate debug output” and lets moteus emit small amounts of telemetry data at every single control cycle, so up to 30kHz. In this post I’ll show how to configure and use it, how to capture the resulting output, and how to plot it or otherwise make use of it.
Concept
The basic principle is that if properly configured, moteus will emit a small number of 16 bit telemetry items to a pin configured as a UART on every control cycle. For this to work, a few things have to happen:
- You need two pins configured as UART on some auxiliary port, either aux1 or aux2.
- The UART mode needs to be set to “debug” and the bitrate needs to be fast enough. 3000000 (3Mbaud) is recommended.
servo.emit_debugneeds to be set to an integer value that is a bitwise OR of the telemetry values you want to log. The selected set of values must be small enough, that combined with the single header byte, the entire frame can be emitted in one control cycle.- An external UART capable of receiving data at 3Mbaud must be connected to the appropriate auxiliary port.
- An operating system and driver must be used which can receive data without dropped bytes at 3Mbaud. In practice, only Linux systems are able to do this easily out of the box.
- You need a tool to parse and plot the resulting data.
Let’s look at each of these in turn.
Setup
1. Pin Configuration
Different moteus controllers have different pins which are capable of being configured as a UART device. The full table can be found in the reference manual here:
https://github.com/mjbots/moteus/blob/main/docs/reference.md#pin-options
For this example, I will use the moteus-r4. For that controller, the only available pins are the two located on the ABS connector.
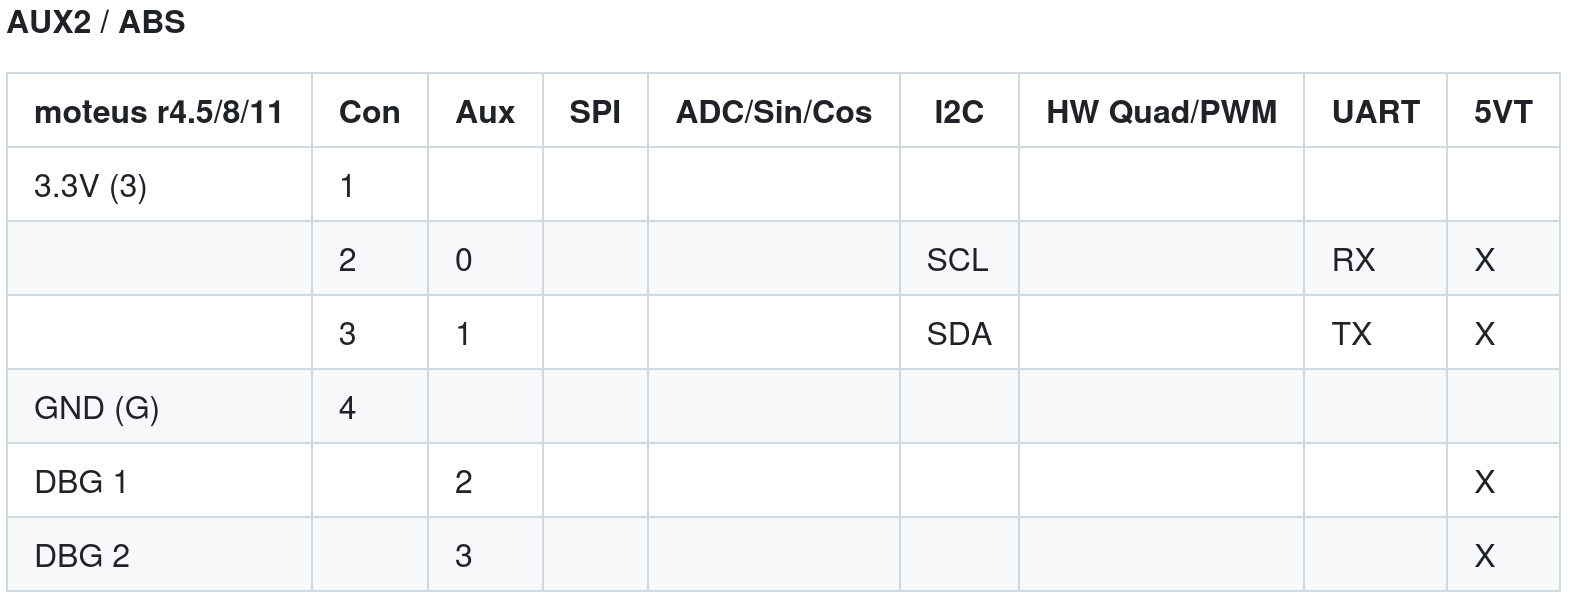
To configure those as UART pins, you would set:
aux2.pins.0.mode 3  # uart
aux2.pins.1.mode 3  # uart
2. Uart configuration
Next the chosen auxiliary port needs to have its UART function configured. To do so, the following configuration values can be set:
aux2.uart.mode 3  # debug
aux2.uart.baud_rate 3000000
3. emit_debug
Next you need to select the values that you want to log. These are not officially documented anywhere and are subject to change from firmware version to firmware version. For a given version, you need to look in fw/bldc_servo.cc:ISR_MaybeEmitDebug(), here is a link to a specific version of that function:
In that function, each possible telemetry value is listed with a line like:
if (config_.emit_debug & (1 << 1)) {
  write_scalar(static_cast<int16_t>(32767.0f * status_.velocity / 100.0f));
}
This implies that the bit for emitting the current velocity is 1 << 1. If you wanted to emit the current velocity, position, and the measured torque for firmware hash ebf25d10fc594800ec65022e345ec46e68872126, that would look like:
* `status_.velocity` - 1 << 1
* `position_.sources[0].raw` - 1 << 11
* `status_.torque_Nm` - 1 << 20
Calculating the logical OR of those values looks like:
Python 3.12.3 (main, Aug 14 2025, 17:47:21) [GCC 13.3.0] on linux
Type "help", "copyright", "credits" or "license" for more information.
>>> (1 << 1) | (1 << 11) | (1 << 20)
1050626
>>>
Then, the final configuration to set is:
servo.emit_debug 105626
For 30kHz pwm rate with a 3Mbaud output, it is possible to log 3 values per cycle. If the pwm rate is only 15kHz, then you could increase the captured items to up to 6 different data points per cycle.
4. External UART
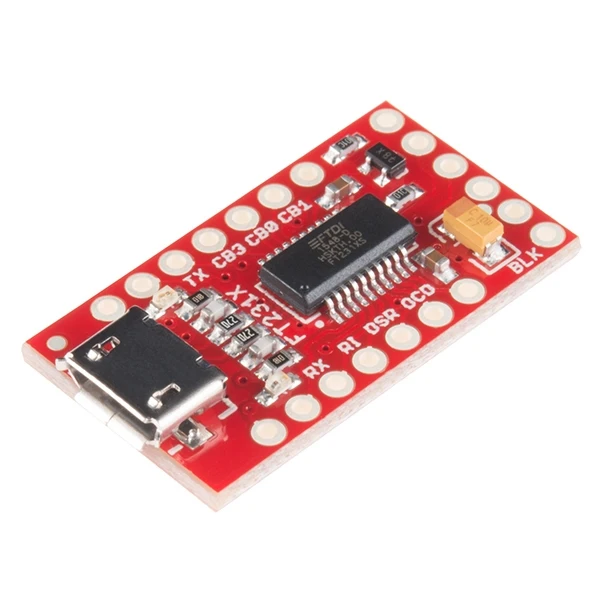
Not many external logic level UARTs are capable of operating reliably at 3Mbaud. One inexpensive variant which is capable of doing so is the FT231X. That chip has readily available inexpensive breakout boards, like this one from SparkFun.
A cable must be constructed to connect the ground of the appropriate aux port and the moteus UART TX pin to the RX on the external UART. One easy option for the moteus-r4 is to purchase a ZH4 to pigtail cable, like this one on amazon
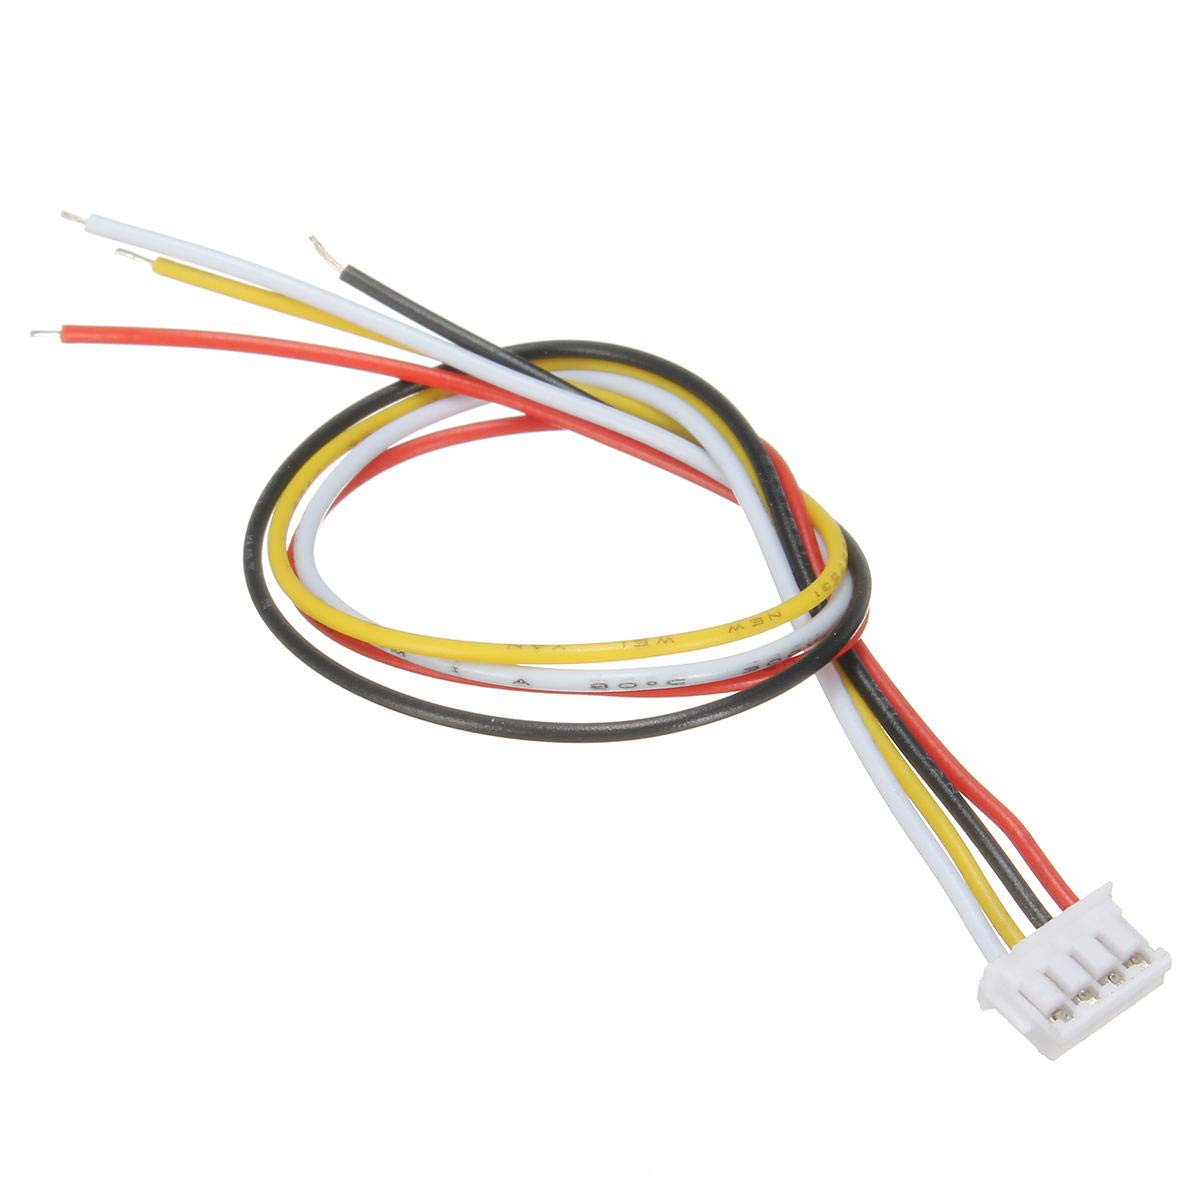
Then the pinout table from above can be used to locate the ground pin, which on widely available cables is often the red wire, and labeled as “G” on the moteus-r4 silkscreen. The moteus UART TX pin, which will be the one immediately next to ground on the moteus-r4 ABS connector, or black on widely available cables, should be connected to the RX line on the FT231X breakout.
5. Operating system configuration and capture
The standard Windows and Mac OSX drivers for FTDI adapters are unfortunately unable to reliably capture 3Mbaud data without dropping bytes. However, with Linux, you can usually get satisfactory results using appropriate command line options.
There are many possibilities to configure and log data on a linux system, but I will document here how to do so using picocom:
sudo apt install picocom
The important parts are:
- using
sudoandchrt 99, which give the process realtime priority - selecting the baud rate
- not attempting to send initialization commands
- configuring an output file to capture raw data
The resulting command line will look like:
sudo chrt 99 picocom \
  --baud 3000000 \
  --noinit \
  --noreset \
  --flow n \
  --logfile /tmp/output.bin \
  /dev/ttyUSB0 > /dev/null
This will log data to the file /tmp/output.bin (and print a bunch of
garbage to the console) indefinitely. To stop logging, <ctrl-a>
<ctrl-x> can be used.
For typical use, you would start recording a data file, then either issue a motion command using tview, a script or an application, then exit picocom once the action was complete.
6. Plotting the results
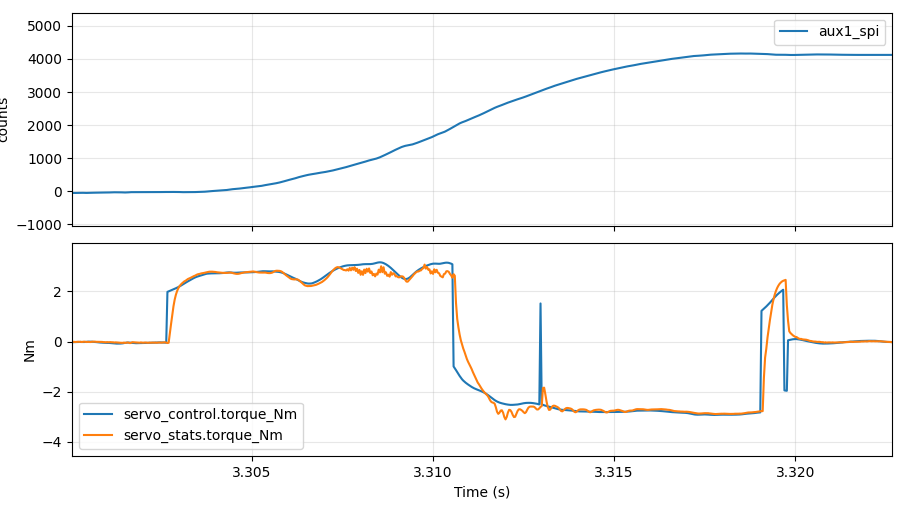
While the data stored can be analyzed manually, it is easiest to use the plot_highrate.py tool from the moteus git repository. The easiest method of using it involves passing the numeric configuration value used with servo.emit_debug. For example, here is the plot of a capture:
moteus$ ./utils/plot_highrate.py -e 1049601 /tmp/20251010-test.dat
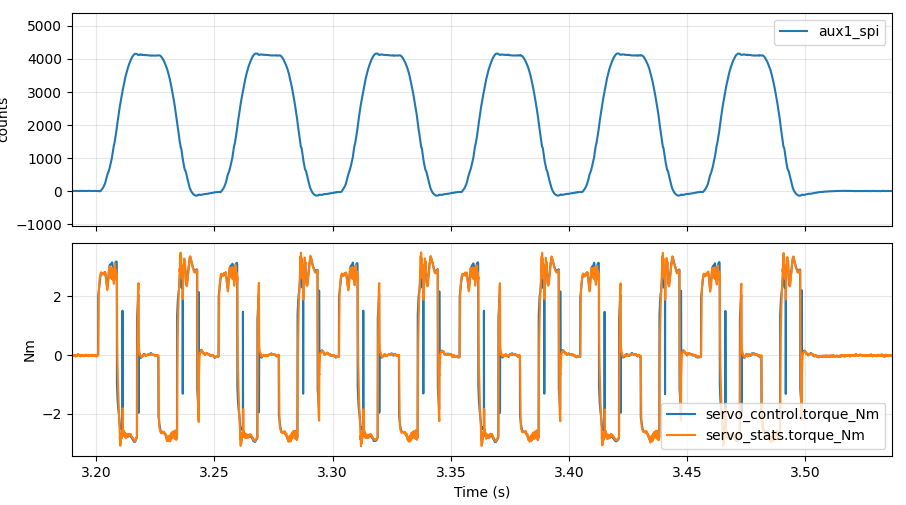
It creates a matplot window, with by default one subplot per distinct unit in the collected data set. Normal matplotlib interaction is possible, so zooming and changing the format works as you would expect. Notably, because the data is captured at the full 30kHz control rate of moteus, you can zoom in and get complete detail over even very short time intervals. Here is a zoom of the above plot, but centered on a 17ms interval where motion is happening. Using CAN-FD, the best you could have achieved was around 40 total sample points, instead of all 510 that this method captures.