Device fault monitoring in tview
When using tview to monitor and control moteus controllers, there have
been a fair number of limitations and “gotchas”. One of the biggest
for newcomers is the distinction between error checking in the d pos
command, and faults that can occur during position mode itself. When
using the diagnostic protocol and issuing a command, for those
commands which direct moteus to perform some control action, the
controller will respond with an “OK” as long as the command itself is
syntactically correct. Only then is it submitted to the online
control loop, after which faults resulting from the command will
manifest as the controller reporting a mode of kFault or 1, with a
corresponding fault code. In the diagnostic tree view, those are
shown as servo_stats.mode and servo_stats.fault.
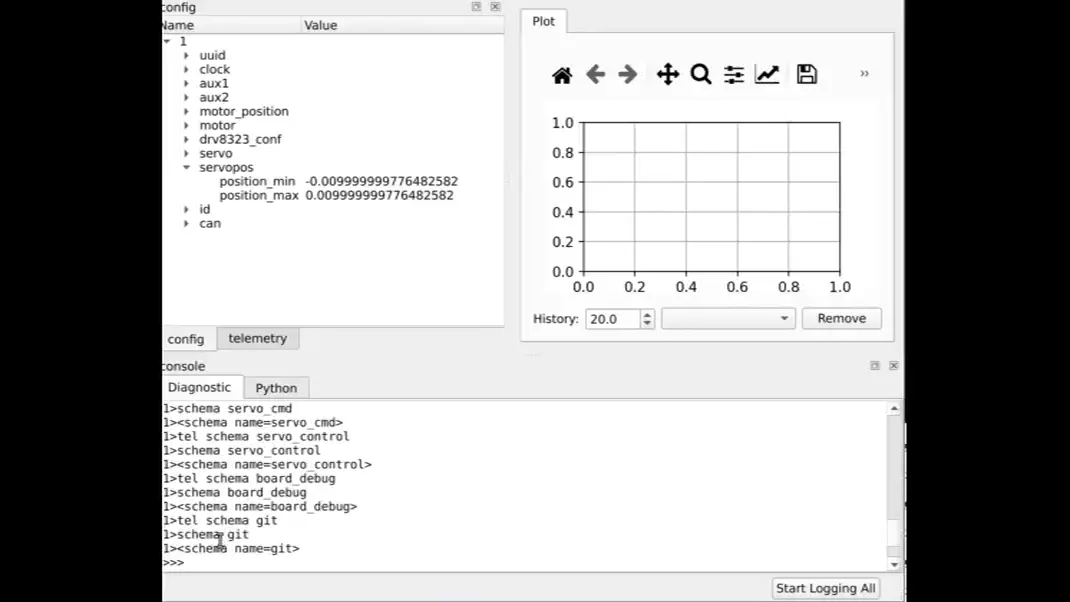
So, what many newcomers do is take a moteus board fresh from the factory, which starts with servopos.position_min=-0.01 and servopos.position_max=0.01, and do the following in order:
- Issue a totally reasonable command like
d pos nan 0 nanto command the motor to hold position - Observe an OK come back
- Don’t see the motor do anything
What those users don’t realize is that in order to see why moteus doesn’t move, you need to look at the current reported mode and fault, not at the response over the diagnostic channel.
Here I’d like to describe a solution to this problem that hopefully makes tview much easier in general with fewer instances of confusion resulting.
Solution
Historically, tview is actually very device agnostic. It knew
basically nothing about moteus itself, aside from that it exposed a
diagnostic interface and had the conf and tel sub-commands.
Everything else is just “how you use it” as they say. However, if
there ever was a reason for that agnosticism, there really isn’t any
longer. Thus, I went ahead and added some logic, and a bunch of
fiddly new UI, to make it more obvious when and why controllers are
reporting faults.
With this new feature, tview will regularly monitor any connected device to see if it has a mode and fault register, and if it does, it will check those values. If it sees any device starting to report a fault it will do two things:
- Start flashing UI elements in a visible red, everything you might need to click on in order to see what the fault is
- Report the current set of devices reporting a fault in the status bar
The flashing will cease when the user either
a) expands the relevant servo_stats subtree
b) clicks on servo_stats while already expanded, or clicks on the
mode or fault sub-item
c) causes the fault to clear through some other reason, like
commanding a d stop
These methods are used independently for all devices connected, so if
you start tview on a bus full of faulting controllers, you may get a
lot of flashing. You can always issue a A>d stop to clear faults
for everything at once if you don’t actually need to see what the
errors were.
The combination of these things will hopefully add the impetus to anyone who issues an unfortunate command to investigate enough to find the actual fault.
Upgrading
This feature is available in moteus-gui version 0.3.93 or newer. You can get it by running:
python -m pip install --upgrade moteus moteus-gui
Good luck!