Moteus performance analysis tool
Recently I showed I was able to use the new dynamometer fixture I built to capture detailed thermal modeling parameters for motor controllers and motors. In this post, I’ll describe how I turned that into the initial version of a tool that lets you compare the performance of different moteus controllers (and some others), along with different motors, to help design an overall motion system.
TLDR: Try it out: Moteus Performance Analysis Tool
Previous posts:
- Part 1: Improved dynamometer
- Part 2: Thermal modeling for moteus and motors - a beginning
- Part 3: Measuring thermal parameters empirically
Motivation
After the recent work linked above, we have the ability to, for an operating point, determine how hot the motor controller will get and how hot the motor will get. Or conversely, given the known maximum temperatures of each, we can determine exactly how much torque at a given speed can be applied. That is very useful information and can help you design a working robot or other motion system. However, that is a lot of math to mangle and many possibilities to consider. I was inspired by pypowertrain, but that tool both was complicated to install and use, and didn’t model all the relevant controller properties. Thus I wanted to make a tool to help people compare controllers and motors and see what would be necessary to achieve their requirements.
My rough goals were:
- Easily compare different solutions: When exploring a design, you want to be able to see which controller and motor you need. The tool should present you with comparisons so that you can see how different controllers, motors, and cooling solutions stack up.
- Single page frontend-only: I want this to be usable by everyone with no install burden.
- Responsive design: There’s no reason this shouldn’t work decently across desktop and mobile clients.
- Copy-paste result pages: Very often people ask specific questions of the form: “can moteus drive this motor”, or “what voltage do I need, or “which controller is best”. I want to be able to share a link to a page showing specific comparisons.
- No build and no external dependencies: In today’s age, I see no reason why a build step is necessary, and I don’t want to be stuck grinding away updating things for newer dependencies as they update their APIs.
Technology stack
I decided to give preact and htm a try for the UI portion of this project. Preact, being modeled on react, has enough user traction that I can easily search/chatgpt solutions to most problems. It doesn’t require a separate build step, and the minified version is pretty tiny. I ended up using curl and unpkg.com to create embeddable artifact of a specific version that I could just paste into the code itself, and thus it requires no additional round trips and no risk of versions changing or external hosts going down.
mjbots/moteus mpat.html - unpkg script
For state management, I really showed my noob-ness with react and web development. Most of the state of each sub-part is needed by the analysis portion, so while there is an abstraction level where the top level component doesn’t need to know in advance what all the state is, it still does eventually have nearly all the state and nearly all state is passed down to nearly every component. Thus the virtual DOM capability of react/preact doesn’t help all that much. That said, since the entire state is passed around as a giant javascript object, it is easy enough to reconstruct it from query arguments, thus enabling copy and paste result pages.
UI
The UI model that I have now is acceptable although it took maybe around 3 iterations to get there. Of course, after getting it to a working state, I have had plenty of new ideas that involve both a radical redesign and radically improved capabilities, but for now this is what we’ve got:
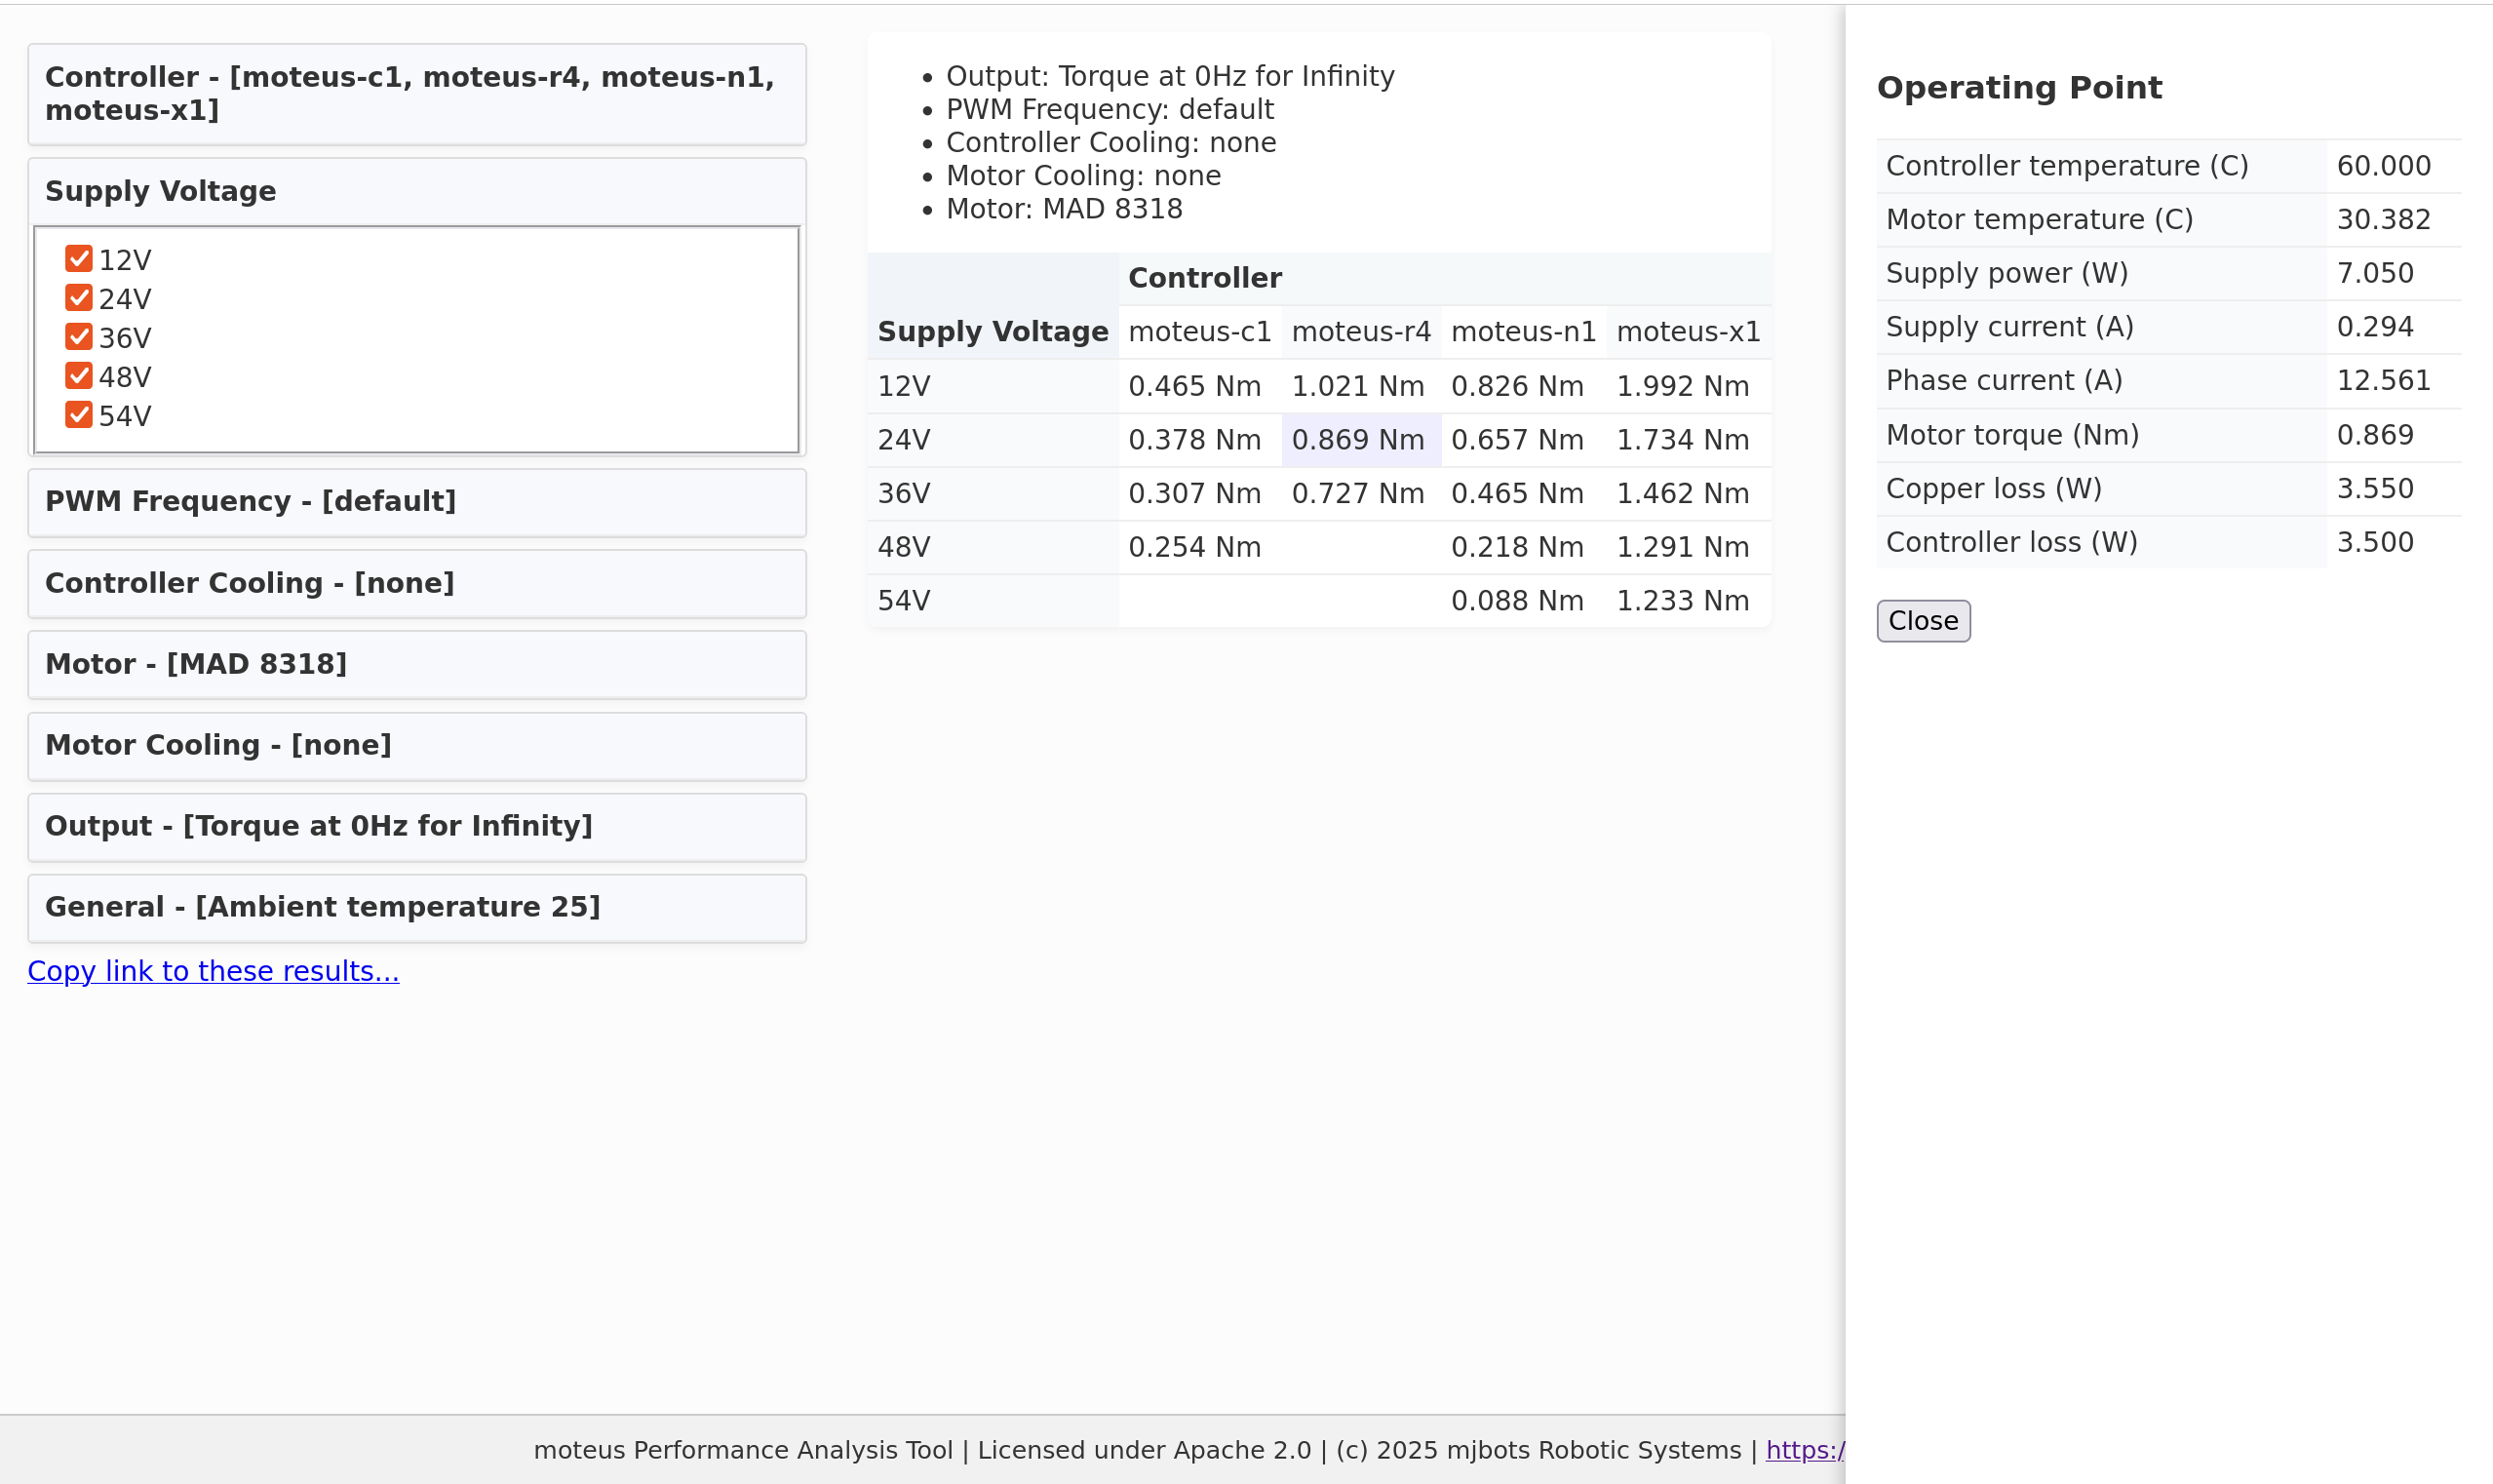
Selection panels: The left hand side of the application has a set of collapsible selection panels. Most panels contain a series of checkable items. If more than one item is checked, then a comparison is evaluated between the different checked items. Items are permitted to have edit boxes, so that you can customize things like the speed or time frame to evaluate. If the selection is collapsed, a brief summary of what items are selected is shown in the header.
Output panel: One of the panels controls what the desired metric(s) are. In practice it looks just like any other panel, except that instead of controlling what configuration is used for the analysis, it controls what values are shown in the results.
Result table(s): The central area of the application shows one or more tables. Each table has a header showing which parameters are constant for every item in the table. The table then has 1 or 2 parameters which vary in the rows and columns, and each entry in the table shows the value for the relevant output metric.
Operation point overlay: If a table entry is clicked, then an overlay is displayed on the right hand side that shows all the relevant data for the operating point in question.
Link copy: An always available link copies a URL that contains most of the current state encoded into the URL query parameter. This allows users to easily share analyses.
As selections are checked and parameters modified, the table(s) in the center are automatically rendered to show the current analysis. If more than two selection panels have multiple items selected, it results in multiple tables shown. The panels are ordered so as to attempt to make each individual table as large as possible.
Performance models
First, let’s look at the controller performance models. There are a couple of additional unique elements to the performance model from what was discussed in the previous posts. The thermal loss function Pc(V, PWM, I) really wants to be continuous, but we only took samples at a set of individual operating points. To resolve that, I broke the problem down into two phases. For a single supply voltage and PWM ratio, the pre-compution step derives a quadratic polynomial in terms of current, which presents three parameters.
$$Pcop(I) = k_0 + k_1 I + k_2 I^2$$
Then, I fitted and found a k0, k1, and k2 for each
pair of supply voltage and PWM frequency used. This generated a
regular 2D table for each quadratic constant. Finally, a simple 2D
interpolation scheme is used to select the kn constants for any
given supply voltage and PWM frequency.
In addition to thermal models, there are many other constraints that are observed during evaluation. Those include:
- maximum operating temperature: each controller has a maximum operating temperature
- maximum supply voltage: each controller has a maximum supply voltage, although other limits may apply even before this maximum voltage is reached as mentioned below
- peak phase current: each controller has an absolute maximum phase current
- power limit: moteus controllers have a specified maximum power
- voltage max power derating: moteus controllers derate maximum power when supply voltage is above a certain threshold
- PWM frequency max power derating: moteus controllers derate maximum power based on the selected PWM frequency
- voltage max current derating: some ODrive controllers derate maximum output current when supply voltage is above a certain threshold
As mentioned in the earlier post, I skipped out on actually measuring iron loss models for any of the motors characterized here. Instead, for each motor, I made an educated guess using the excellent pypowertrain tool.
One characterization I did make for most of the motors was to model their saturation curves. For this, I used the dynamometer to apply continually increasing currents, measuring the applied torque at each point. For each, I then fit the moteus saturation region model to the results.
Finally, the ODrive models included in this tool were derived purely empirically with reference to the documentation where it helped. I take full responsibility for any inaccuracies, although I did my best to measure their properties with the same level of fidelity as I used for the moteus controllers.
Caveats
As with any practical work that does not have an infinite time budget, there are many caveats, exclusions, omissions, etc even within the current feature set.
-
Maximum cooling: I have not worked very hard to achieve “maximum cooling” for any particluar device yet. Specifically for the ODrive models, I mounted them so as to use the on-axis encoder, which precluded using the provided heatsink and fan. For most controllers, the “maximum cooling” option involved me trying whatever random stuff I had, including pointing giant fans at the resulting system, just to see the best result I could get.
-
ODrive PWM selection: ODrive controllers do not allow the PWM frequency to be altered. To make comparison easier, the tool currently treats all frequencies as if they were the 20kHz frequency that the controllers use for displaying ODrive results.
-
“questionable results”: There are various cases where the tool produces an output, but likely knows that it is incorrect. Say because a motor doesn’t have a saturation model and the current is very large for the overall motor mass. It would be nice if the tool could indicate that results in such regions are unlikely to be great.
Characterized Devices
In the end, I characterized the following controllers:
- moteus-c1
- moteus-r4
- moteus-n1
- moteus-x1
- ODrive Micro
- ODrive S1
- ODrive Pro
The following motors:
- mj5208
- MAD 8318
- Rctimer GBM5208
- Gyroor 8.5” hoverboard motor
- HT1105
- BE8108
The following controller cooling solutions:
- Ambient
- Heat spreader
- Heat spreader w/ heat sink
- 5V 40x20 fan (moteus-c1, moteus-n1, moteus-x1, ODrive S1, ODrive Pro)
- 12V 40x20 fan (moteus-x1, ODrive Pro)
And the following motor cooling solutions:
- Ambient
- A “big” fan
Future work
There is a large list of features that I want to add, not the least being a complete redesign of the UI! Some of the biggest features are inclusion of optional gear reduction, simple motor model estimation from datasheet parameters, and pypowertrain style graphical plots. That of course doesn’t even count how valuable it would be to model more motors and actuators! For now though, this at least lets people do basic comparisons and will serve as a decent stake in the ground.