callgrind profiling of embedded targets
When performing optimization or micro-optimization on desktop applications, callgrind combined with kcachegrind are one of my favorite combinations. While slow to run, it gives you precise information about where instructions are spent and has at least a decent way of moving up and down the call frame or digging into disassembly. The downside, is that it largely only works if you can run the application on your host processor, which isn’t that relevant when working with embedded targets like STM32 (or other) microcontrollers. Recently, I got fed up trying to find more cycles to shave off the moteus firmware, and decided to take a stab at making at least a minimal solution.
Enter: https://github.com/jpieper/gdbundle-gdb-callgrind
This is a python language gdb plugin, that when run, performs single instruction stepping on the current target. At each step, a backtrace is generated from gdb, and that information is used to emit a callgrind compatible log file. With appropriate debug information, the backtraces include inlined functions and tail calls, so that you can get a good idea where there is room for improvement even with high levels of optimization enabled.
It is packaged as a gdbundle plugin, if you have that configured, installation is as simple as:
pip install gdbundle-gdb-callgrind
Then, connect to your target in gdb, break at the start of the function you want to profile, then enter at the gdb prompt:
emit_callgrind
At that point the tool will single step until the end of the function, emitting a callgrind.log.X file that kcachegrind can interpret. If this is run in the top level source tree, then kcachegrind will hopefully be able to locate all the source code with no problem. If you want to look at disassembly of a target, kcachegrind provides no native facility for disassembling non-host applications. You can work around this to a degree by symlinking the appropriate objdump into your current working directory, then running with a custom PATH like so:
ln -s /usr/bin/arm-none-eabi-objdump objdump
PATH=.:$PATH kcachegrind
Note that kcachegrind has a propensity to trigger an assert and crash when used with a non-host objdump that I haven’t figured out how to resolve. For my purposes, I just restart kcachegrind with the host objdump, navigate to a different file, then exit and restart it with the PATH altered and hope for the best.
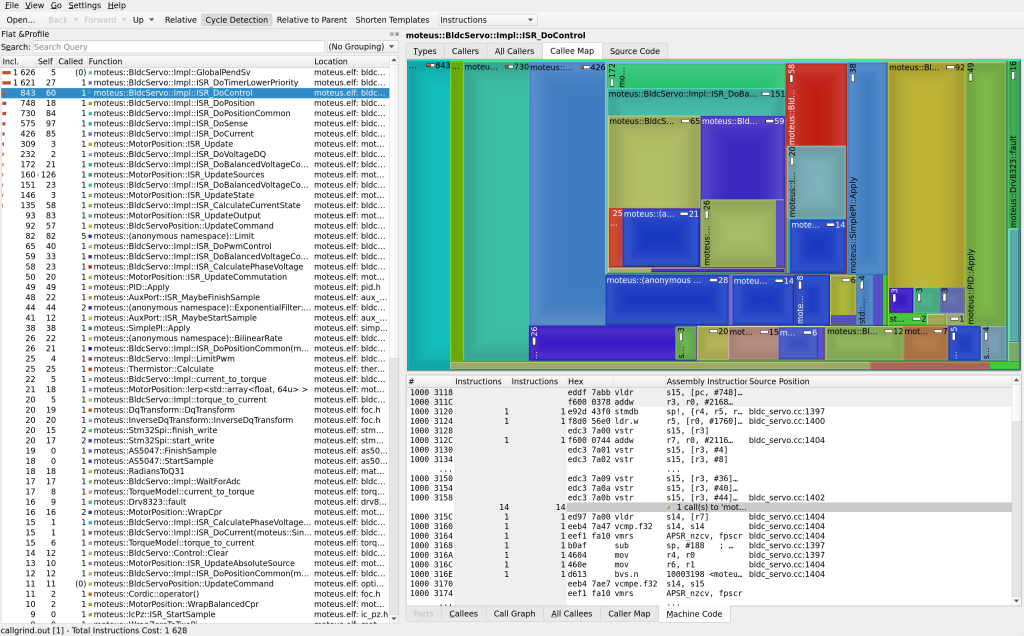
Here’s a sample output showing a subtree of the main moteus ISR: